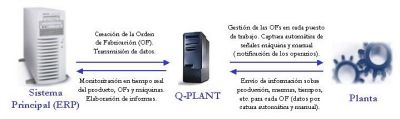
Q-PLANT© is a supervisory control and data acquisition system for manufacturing plants. It coordenates, distributes, manages, represents and integrates information from the main system and plant core elements (manufacturing orders, machines and workers) in live.

When implementing Q-PLANT©, the main objectives to achieve are the following:
|

|
Eliminate all documents (duplicates) issued by different departments that are required in the manufacturing area.
|
|
|
Eliminate paper (MO sheet, technical sheet, labels, daily sheets, etc.).
|
|
|
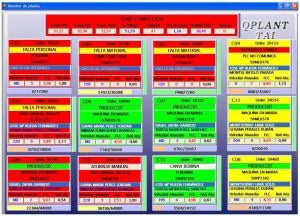
Live monitorization of what is taking place at any time in the manufacturing area.
|
|
|
Availability of the last minute information about MO.
|
|
|
Receive live results & forecasts in order to:
|

|
Reduce non productive time.
|
|
|
Reduce units rejected or crap material.
|
|
|
Slim lead manufacturing times.
|
|
|
|
Eliminate worker's manual tasks (for intance, writing the daily report).
|
|
|
Gain all advantages related with accurate live data.
|

|
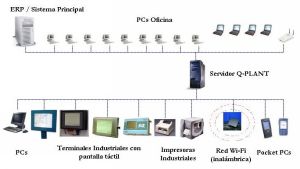
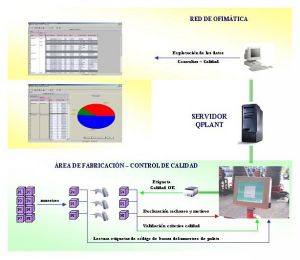
A prototype of the system architecture for Q-PLANT© consists of the following components:
|
|
ERP o Main system in a LAN with PCs or laptops connected to the office network.
|
|
|
Q-PLANT© Server in an independent LAN.
|
|
|
Hardware in the manufacturing area (PCs, industrial PCs with touch screen, industrial printers, ethernet or wireless networks, pocket PCs, etc.).
|
|
|

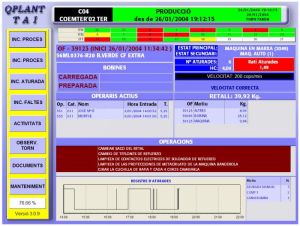
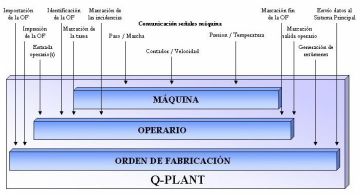
Q-PLANT© acquires and manages live information from the manufacturing plant. The data collected can be summarised in the following activities:
|
|
Activity of the machines:
|
|
Present situation (production, mechanical failure, stop, shutdown, etc.).
|
|
|
Groups by situation (standstill, production, organization, etc.).
|
|
|
Input data relation by transition of situation (production-failure-maintenance-preparation).
|
|
|
Information control (PLC data, active MO, assigned workers, etc.).
|
|
|
Manufacturing control through PLC data versus manual input data by workers (deviations).
|
|
|
|
Activity of the workers:
|
|
Time controls (start / end of every activity / tasks, ...).
|
|
|
Workers' hierarchy (foreman, machine assistant, worker, operator, ...).
|
|
|
Worker / machine location.
|
|
|
Presence time versus production / failure / shutdown time, ...
|
|
|
Linking the production level of every worker according to the bonus calculation.
|
|
|
Traceability of the workers' activities in different machines throughout a shift.
|
|
|
|
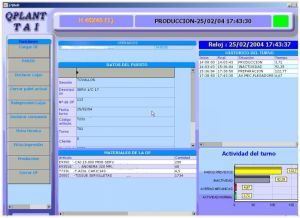
Activity of the Manufacturing Order:
|
|
About the product (What are we manufacturing?, How much so far?, How much is left?, data about the BOM (bill of materials) / product structure / formula / plans / technical features, ...).
|
|
|
About the processes (Where is it manufactured (section / line / machine)?, Routes / Operations / Phases, theoretical time versus real time - deviations, ...).
|
|
|
About the materials (What is the structure of the final product (componentes / composition)?, consumption lots, theoretical consumption versus real consumption - deviations, ...).
|
|
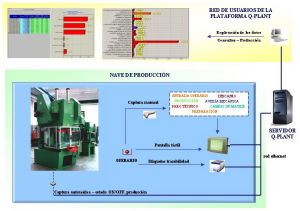
The standard operations workflow for a worker in a given machine during a shift with automatic and manual data collection can be described as follows:

|
Monitorization and machine signal management in Q-PLANT© is performed at two different levels: through manual data acquisition (workers inputs) or automatic (machine PLC signals). The data acquisition and management, with relation to production and processes in the manufacturing area, can be split in different stages:
|
|
1.-
|
Data collection about manufacturing processes and machine states. Through a communication interface between the machines PLC in every section and the industrial terminals located in the manufacturing plant it is possible to collect the machine signals automatically (pressure, humidity, temperature, cycles, units manufactured / rejected, machine states, ...).
|
|
2.-
|
Every situation related with the manufacturing process (shutdowns, cleaning, maintenance, production, preparation, failures) is informed by the worker through the industrial terminal located in the nearby of his workplace. To do so, first he has to select his machine (in case the terminal is monitoring several machines at the same time) and next he will notify the input data according to the situation of his workplace.
|
|
|
|
|
|
3.-
|
In order to keep a traceability of the WIP (work in process) and final products, every time a palet is completed, Q-PLANT© sends and order to the industrial printer for an adhesive label with a bar code about the product, the MO (manufacturing order) and the RM (raw materials) used in the process. This will allow a complete traceability of the palet when going through the quality control process, as well as a proper location management when the palet enters the warehouse.
|
|
4.-
|
All the information that is constantly created in the manufacturing area is live sent to the Q-PLANT© server in order to make all data available for the office users, who will create manufacturing reports.
|
|

|
Q-PLANT© can be integrated within the quality control procedures already established in the manufacturing area of any company. The objective is turn into computer data the whole process to allow a swift and accurate data analysis, compare it with historical stored data in order to evaluate the SLA (Service Level Agreement) throughout the time. The data acquisition and management, with relation to quality processes in the manufacturing area, can be split in different stages:
|
1.-
|
The worker selects the palets or boxes for the sampling. With the assistance of a specific Q-PLANT© screen, according to the requirements of the Quality department, the worker will select the sample palets or boxes out of the weekly or daily production.
|
|
2.-
|
With a code bar scanner, the worker will identify in Q-PLANT© the palets and boxes about to go through the quality control. Every time he reads one palet label, all relevant data about the palet is displayed on the screen (MO (manufacturing order), reference code and description, quantity, date, machine, raw materials, etc.)
|
|
|
|
3.-
|
The worker starts the quality control test over the sampling selected. The outcomes of the quality data test are introduced in Q-PLANT© through the touch screen. It is possible to perform partial quality data tests, for MO or for the entire customer order, depending on the number of lots taken in the sampling. If one or several palets or boxes dont meet the required quality levels, the worker will notify on the screen the rejection reasons and its nature. The affected palets or boxes are set apart with a rejection label, waiting for the final decision: consider the product as scrap or take it back to the manufacturing area to go over further processes to accept it.
|
|
4.-
|
Every palet or box that goes through the quality test is sotred in the Q-PLANT© database, so that everybody knows that palet or box has been tested by the Quality department.
|
|
5.-
|
All the information that is constantly created by the Quality department is live sent to the Q-PLANT© server in order to make all data available for the office users, who will create quality reports.
|
|

|
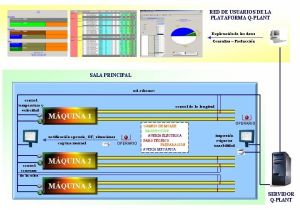
Due to the fact that the collected live data from the industrial terminals in Q-PLANT© is versatile, it is possible to enable a live alarm communication system between the manufacturing plant and the manufacturing department. This communication system is automatic and is activated depending on the deviation of the critical parameters of the machine signals collected by Q-PLANT©. Next there are some descriptive examples of difeerent situations that may take place:
|
|
|
Set up a time to activate the alarm when the meter / units / kg counter of the machine registers no material input, although the machine is ON and its present situation, according to the worker, is Production. Time frame: 3 minutes. The section leader receives a message in his PC informing of the machine location, its present situation and the performance fall in the last three minutes.
|
|
|
When a production channel of the machine holds a speed with a deviation with respect to the standard speed higher than 20%, the red light of the traffic light activates and the maintenance head receives a message in his PC informing of the machine location and the nature of the deviation.
|
|

|
|
|
When a machine presents a pressure, speed or temperature deviation of the raw material processing (injection machine, for instance) that is unacceptable according to the established parameters by the company, the red light of the traffic light activates and the maintenance head and the manufacturing leader receive a message in their PC informing of the machine location and the nature of the deviation.
|
|

Q-PLANT© is highly configurable by the key users:
|
|
Situations and machine states (production, failures, maintenance, shutdown, ...).
|
|
State of the entities (machine, MO, workers, identification colours,...)
|
|
|
Input registration.
|
|
|
Action over signals (receive, change, cancel, ...) traffic lights.
|
|
|
Control parameters concerning different situations.
|
|
|
Sending messages to the terminals (dialogue with workers).
|
|
|
Establish allowed inputs depending on the workplace situation (Allow workers entrance, MO, scenarios,
).
|
|
|
|
Automatización de actividades periódicas (turnos, volcado de datos con el ERP).
|
|
|
Collection fo required data from the hardware in the manufacturing area.
|
|
Pieces rejected (data input).
|
|
|
Type of consumed component (according to the MO)
|
|
|
Remarks or comments (free field).
|
|
|
|
Alert definition and triggering action.
|
|
Tolerance and limits for every parameter: speed, temperature, cycle time, units, etc.
|
|
|
Situation and state of the machine in the workplace:
|
|
|
Failure (activate traffic light, send message to,...).
|
|
|
Data acquisition from the hit counter, etc.
|
|
Every Q-PLANT© implementation is a new challenge. Standard Q-PLANT© has to be customized according to the real needs of every customer and in every manufacturing plant: for instace, selecting an industrial touch screen PC enhances the broad range of communication interfaces available for the workers.

The improvements directly related with implementing Q-PLANT© are the following:
|
|
Machines Improvements.
|
|
Situation and state of the machine (ON/OFF, production, shutdown, failure, ...).
|
|
|
Group machines by situation (standstill, production, organization, etc.).
|
|
|
Input data by transition (production-shutdown-preparation-production).
|
|
|
Linking machine situations and states with messages and alarm messages.
|
|
|
Identify the kind of machine states and situations:
|
o
|
shutdown
|
|
o
|
Failure
|
|
o
|
Cleaning
|
|
o
|
Production
|
|
|
|
Monotorization of the machine signals (communication interface with Q-PLANT©):
|
o
|
Unit counter (OK/NOK).
|
|
o
|
Machine states (ON/OFF, production, failure,...).
|
|
o
|
Quality parameters (scales, electronic devices, ...).
|
|
|
|
|
Manufacturing Order Improvements.
|
|
Improvements in production planning: time is considerably reduced in order to make changes in the machine as a result of optimizing the MO sequence.
|
|
|
Improvements in the quality area.
|
o
|
Immediate intervention in case of quality control problems in the production line.
|
|
o
|
Constant track of the product as a result of real time identification of half finished goods and checkout on the spot the assembly of components.
|
|
|
|
Improvements in monitoring units rejected.
|
o
|
real time control that allows implementing adjustments in order to minimize its volume, as much in levels of units rejected as redundancy consumption of materials or components.
|
|
|
|
Improvements in productivity.
|
o
|
OBJECTIVE reports about timing process, time of preparation and incidences, that allow minimizing the loss of time.
|
|
|
|
|
Workers Improvements.
|
|
Improvements in monitoring dead times.
|
o
|
Dead times are reduced due to identification of all possible workers scenarios (control of non justified time).
|
|
|
|
Improvement in communication.
|
o
|
Workers can be located at any place within the shop floor through its identity code, including the enhancement of direct communication through messages to the terminal.
|
|
|
|
Improvements in the information about workers bonuses.
|
o
|
Input of all required data in the system in real time. It will enhance:
|
-
|
Get more objective data that improves the overall plant performance.
|
|
-
|
Monitor the working pace in order to establish the right premium goals.
|
|
|
|
|
Improvements in the core information.
|
o
|
More objective information is achieved (worker/machine hours relation, time follow-up by worker/MO, cost data, control of workerss activities (previously unknown or not controlled situations)).
|
|
|

|
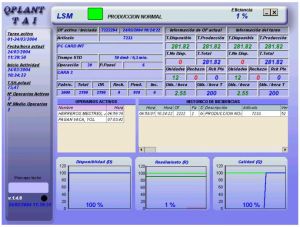
The main advantages of implementing Q-PLANT© can be summarised as follows:
|
|
Follow-up of the MO, workers & machines:
|
|
Actual situation of the MO: pending, queued (priority), production, finished,....
|
|
|
Queue management (planning of the MO load by machine, gather the MO priority list through the terminal, ...).
|
|
|
Workers location (presence control software in the shop floor, input date, work in process, work place state, ...).
|
|
|
Manufacturing reports.
|
|
|
Combined analysis of all entities (machine, MO, workers, incidences, shifts, period of time, etc).
|
|
|
|
|
Monitoring in real time the shop floor:
|
|
Active or non active workplace (ON/OFF).
|
|
|
Machine situation (production, failure, prepared,...).
|
|
|
Workers presence (active, sick, available,...).
|
|
|
Present production (compared with objective).
|
|
|
Manufacturing pace (customizable scale).
|
|
|
Situation of the MOs in the machine (assigned, pending,...).
|
|
|
Messages sent/confirmed to the workers workplace.
|
|
|
Manufacturing area situation (x machines in A, n machines in B,...).
|
|
|
Active workers (Who is working?).
|
|
|
Work in process products (What are we manufacturing?).
|
|
|
Clients (Who are we working for?).
|
|
|
|
|
|
Product Track & Quality Control.
Product track in the manufacturing line:
|
|
Through the manufacturing process.
|
|
|
Through the product.
|
|
|
Through the materials consumption.
|
|
|
By workers intervention.
|
Quality control linked with a product/worker/MO/machine:
|
|
Registry of reference (standar) values.
|
|
|
Control by units manufactured.
|
|
|
Control of manufacturing time by unit.
|
|
|
Control of machine parameters.
|
|
|
Control of product variables.
|
|
|
|
Q-PLANT© assist the office user through dinamic reports and customizable graphics.
|
|
|
Q-PLANT© reports can be exported to other supports for further analysis (Word, Excel, txt) or can be send by e-mail (HTML format) directly from the platform.
|
|
|
It is possible the database communication with most of the commonly used ERPs in the market (BPCS, ProdStar, SAP R/3, PG400, Navision, BAAN, JD Edwards, PeopleSoft, customized applications, ...)
|
|

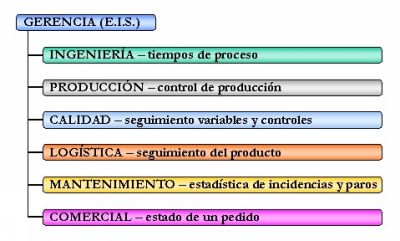
Departments interested in taking advantage of Q-PLANT© live information are described in the following image:
Copyright © 2004 Taired, T.A.I. S.L. All rights reserverd.
Contáct us